Working With Data, Data Formats
Please note: to use these files locally on your own computer, you will need to load them from an address starting in "http://" rather than "localhost". The .csv file will not load in a browser without the proper address.
You can do this by starting a local server on your computer. We'll cover this process, and install node.js in class on March 25. Feel free to get started with node.js in the meantime if you already have it on your machine, or you are familiar with the command line. You can also start a local python server without having to install anything, by following the instructions at the link above.
If you're already familiar with using local server instances in Stack applications like MAMP, WAMP or XAMP, your htdocs folder in any of these should work for hosting this file, and loading the .csv into the sketches, as well.
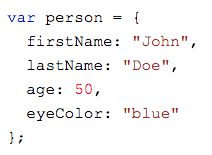
JavaScript can work with data in multiple formats. We've looked at how single variables in JavaScript can hold strings, numbers, and boolean values (true/false). Objects in JavaScript are also data, in a very specific format of "key-value pairs".
p5.js, and many other libraries also have functions for dealing with data in different kinds of formats you might find it in, like .CSV or "tabular data"
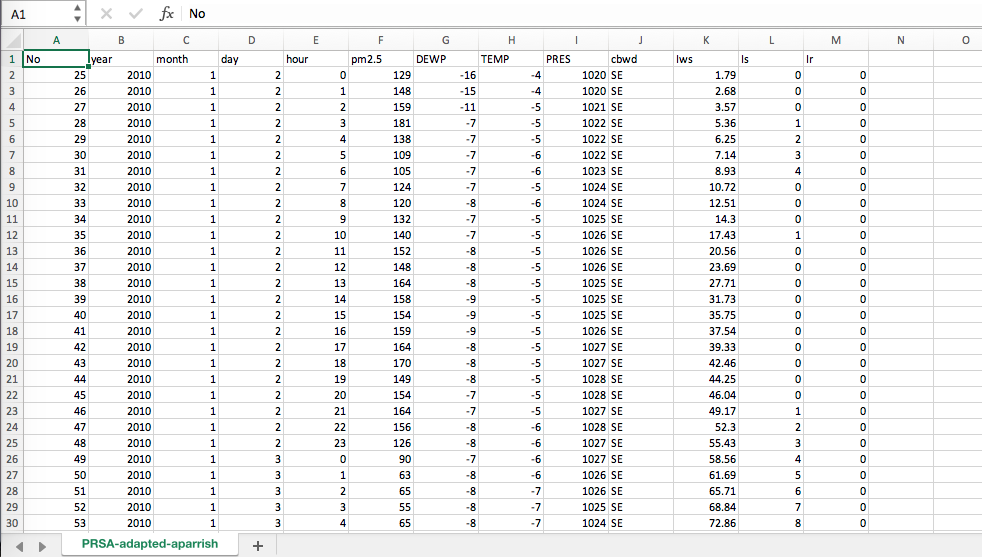
The table above is .CSV (comma separated value) data. When viewed in a program like excel or google sheets we tend to format it in tables for human readability. Excel and Google can read and export .csv files. When a computer reads it, it prefers to look at tabular data like this:
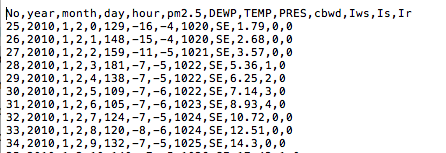
NOTE: These two files above show, and are, the same thing. The p5 examples in this page are adapted from Allison Parrish's p5.js CSV tutorial and work with this .csv file which lives in the "Data_PartI" folder. P5 has methods for loading and working with CSV data: loadTable().